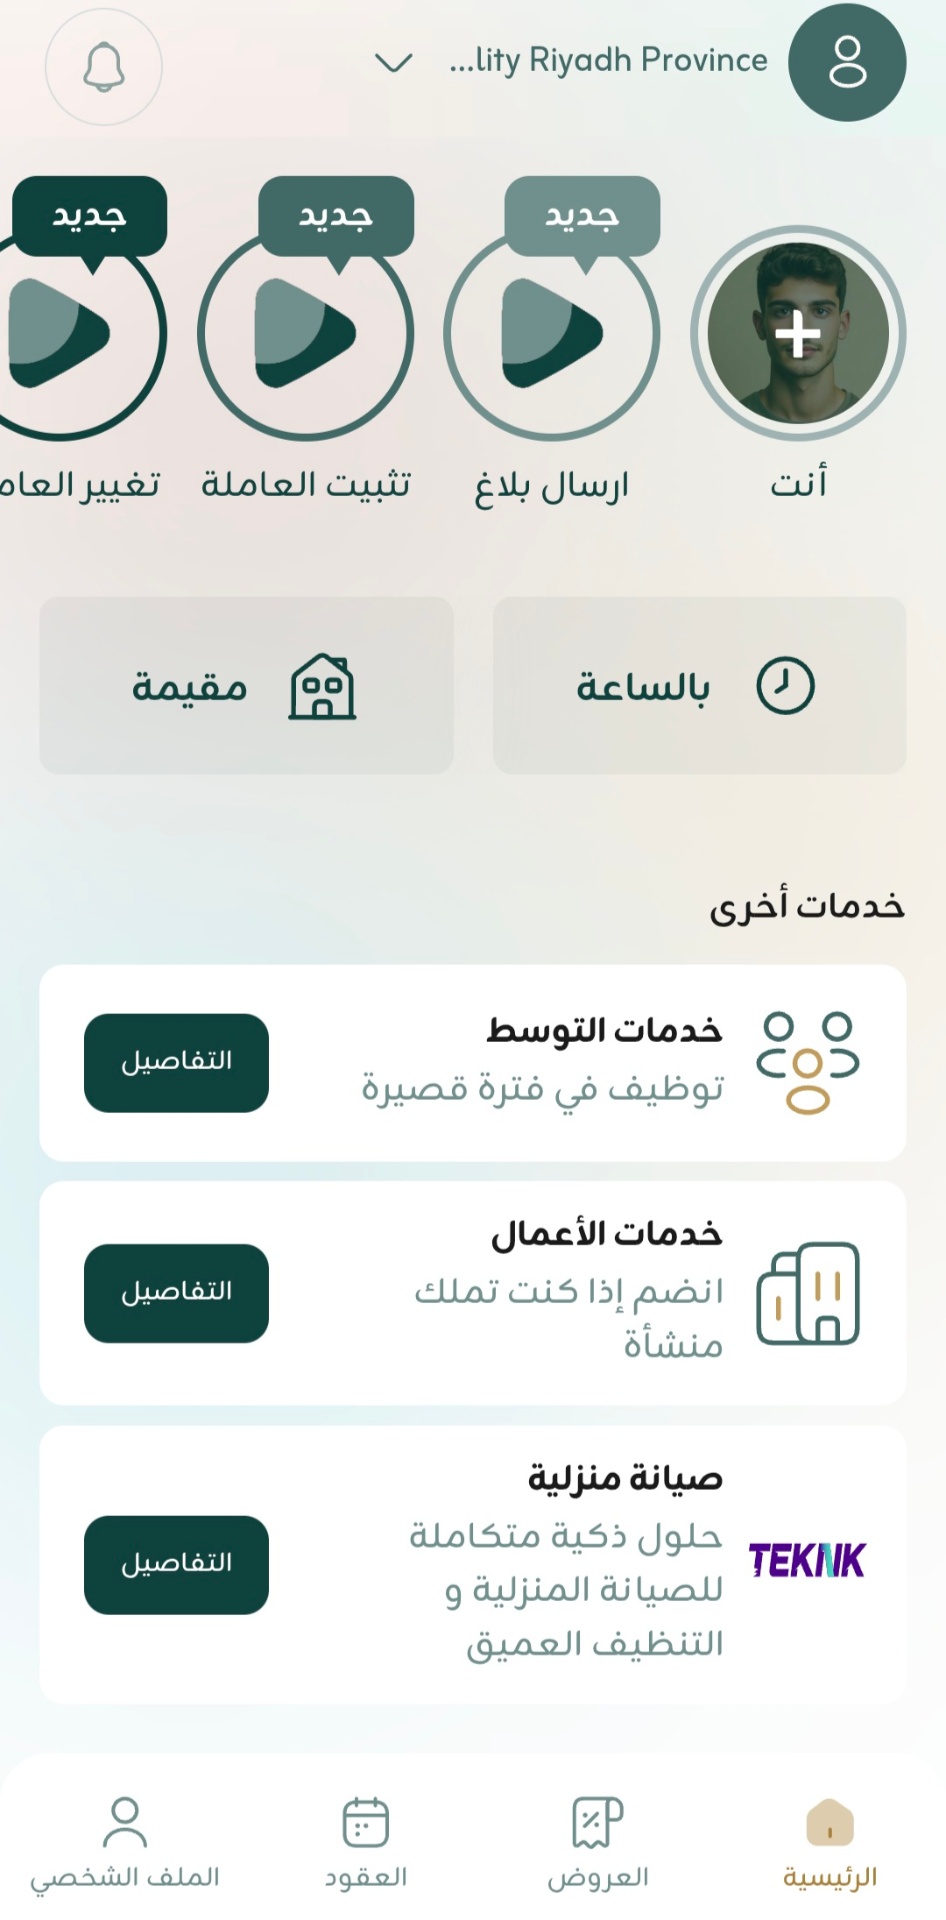
Client case study, Maharah, On-demand home services, Saudi Arabia

We turned an app that only counted installs into one that knows how to make money.

In six months we rebuilt Maharah's Google Ads account from a top-of-funnel install machine into a full-funnel revenue engine, and it paid back $21.62 for every dollar spent.

Start with a risk-free audit →See the numbers
Maharah app
Maharah logo
21.62x
Return on ad spend
$2.22M
Conversion value
188K
Conversions
$0.61
Cost per install

Who we worked with

Convenience is the whole product.

Maharah is a Saudi on-demand app that lets people book home services in a few taps, cleaning, a private chef, in-home massage, babysitting, elderly care, a private driver. Instead of calling around, users open the app and have a vetted professional on the way in minutes.

When the entire value proposition is convenience, the app has to turn browsers into bookers fast, which makes every ad dollar a question of quality, not just volume.

CleaningPrivate chefIn-home massageBabysittingElderly carePrivate driver
Where we started

A funnel with no bottom.

The account could grow installs all day. What it couldn't do was tell us which of those installs ever became a paying customer.

01
Every dollar chased downloads

Every campaign ran as an App Install campaign on Maximize Install Volume, optimizing toward taps on "install", never toward in-app purchases or revenue.

02
No tracking, no visibility

There was no real conversion tracking in place, no read on which channels performed, no in-app purchase data to bid toward, no way to tell a good install from a wasted one.

What we did

From installs to revenue.

We rebuilt the account on Performance Max and paired App Install campaigns with in-app-action and in-app-action-value bidding, so spend could finally chase people who use the app and pay. The goal was never fewer installs, it was better installs.

Top 10-20%
Installs & awareness

Install campaigns targeting genuinely new users only, existing customers and purchasers excluded, with YouTube & Display prospecting.

Mid/bottom 60-70%
Performance Max

The revenue engine, split three ways: pMax with in-app purchases (per region & service), pMax with local conversions, pMax with B2B leads.

Bottom 20-30%
Re-engagement

Android & iOS re-engagement on Target CPA, bidding toward in-app actions, nudging everyone who already has the app toward their first or next booking.

The results

Numbers don't lie. And we don't dress them up.

Six months, January to June 2026. Every figure is straight from the account.

21.62x
Return on ad spend
$21.62 back for every $1 spent
$102,536
Ad spend (SAR 384,511)
188,105
In-app conversions
$2.22M
Conversion value (SAR 8.31M)
6 mo.
January to June 2026
Account performance, Jan to Jun 2026
Where the return came from

Performance by channel.

ChannelSpendConv. valueROAS
App campaigns
37,879 installs @ $0.61
$23,204$503,13121.68x
Performance Max
Revenue engine, largest budget share
$64,819$859,35413.26x
SearchMost efficient
Brand protection & highest-intent
$10,815$850,32778.62x
YouTube Shorts
In-app purchases
$532$4,2427.97x
App campaigns
37,879 installs @ $0.61
Spend
$23,204
Conv. value
$503,131
ROAS
21.68x
Performance Max
Revenue engine, largest budget share
Spend
$64,819
Conv. value
$859,354
ROAS
13.26x
SearchMost efficient
Brand protection & highest-intent
Spend
$10,815
Conv. value
$850,327
ROAS
78.62x
YouTube Shorts
In-app purchases
Spend
$532
Conv. value
$4,242
ROAS
7.97x

Want Google Ads that pay for themselves 20x over?

We work with a maximum of 7 clients at a time. Book a free intro call and we'll tell you honestly whether we can move the needle for you.

Start with a risk-free audit →